Scientific intelligence on your workstation.
Analyze characterization data, trace every result to the process that made it, and plan the next run with AI that runs in our cloud, on your servers, or on a single air-gapped workstation.
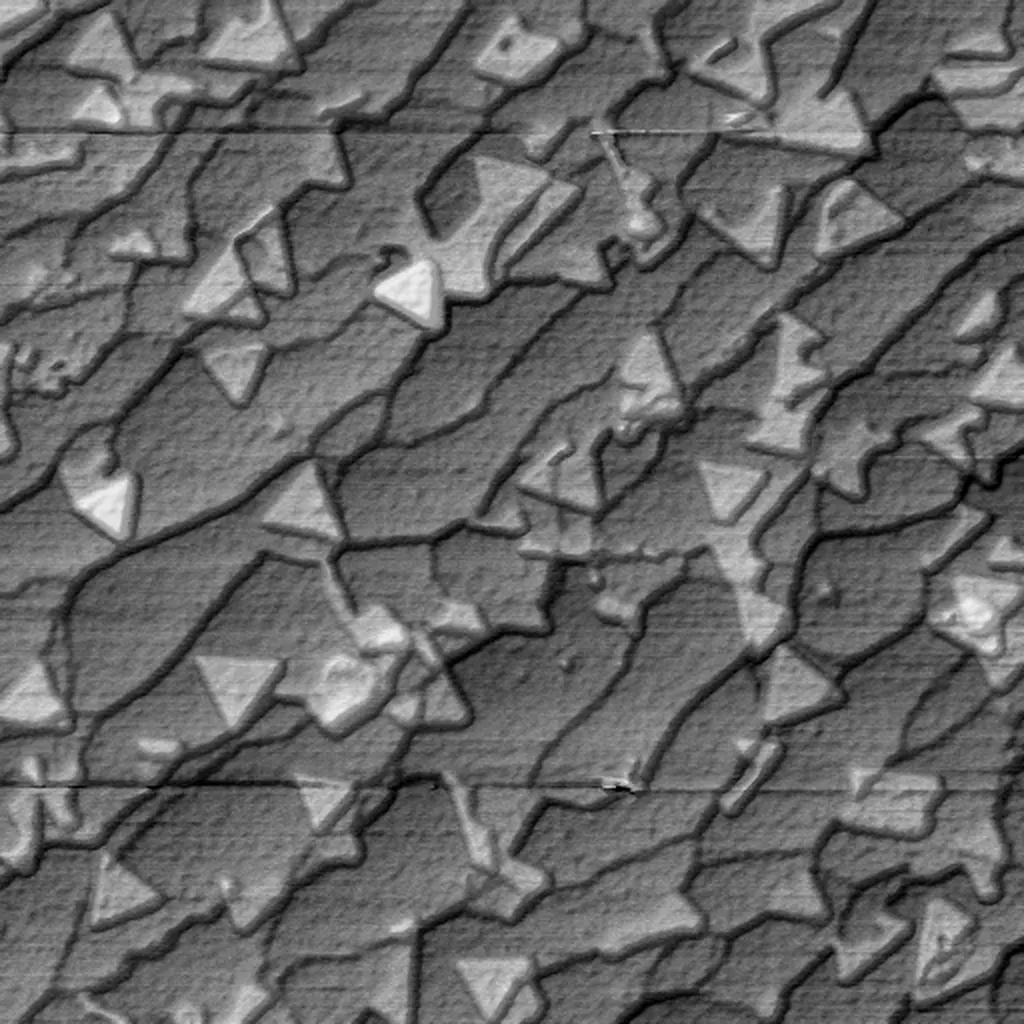
- Islands
- 82
- Monolayer step
- 0.57nm
- Coverage
- 22.7%
- Median island
- 1,737nm²
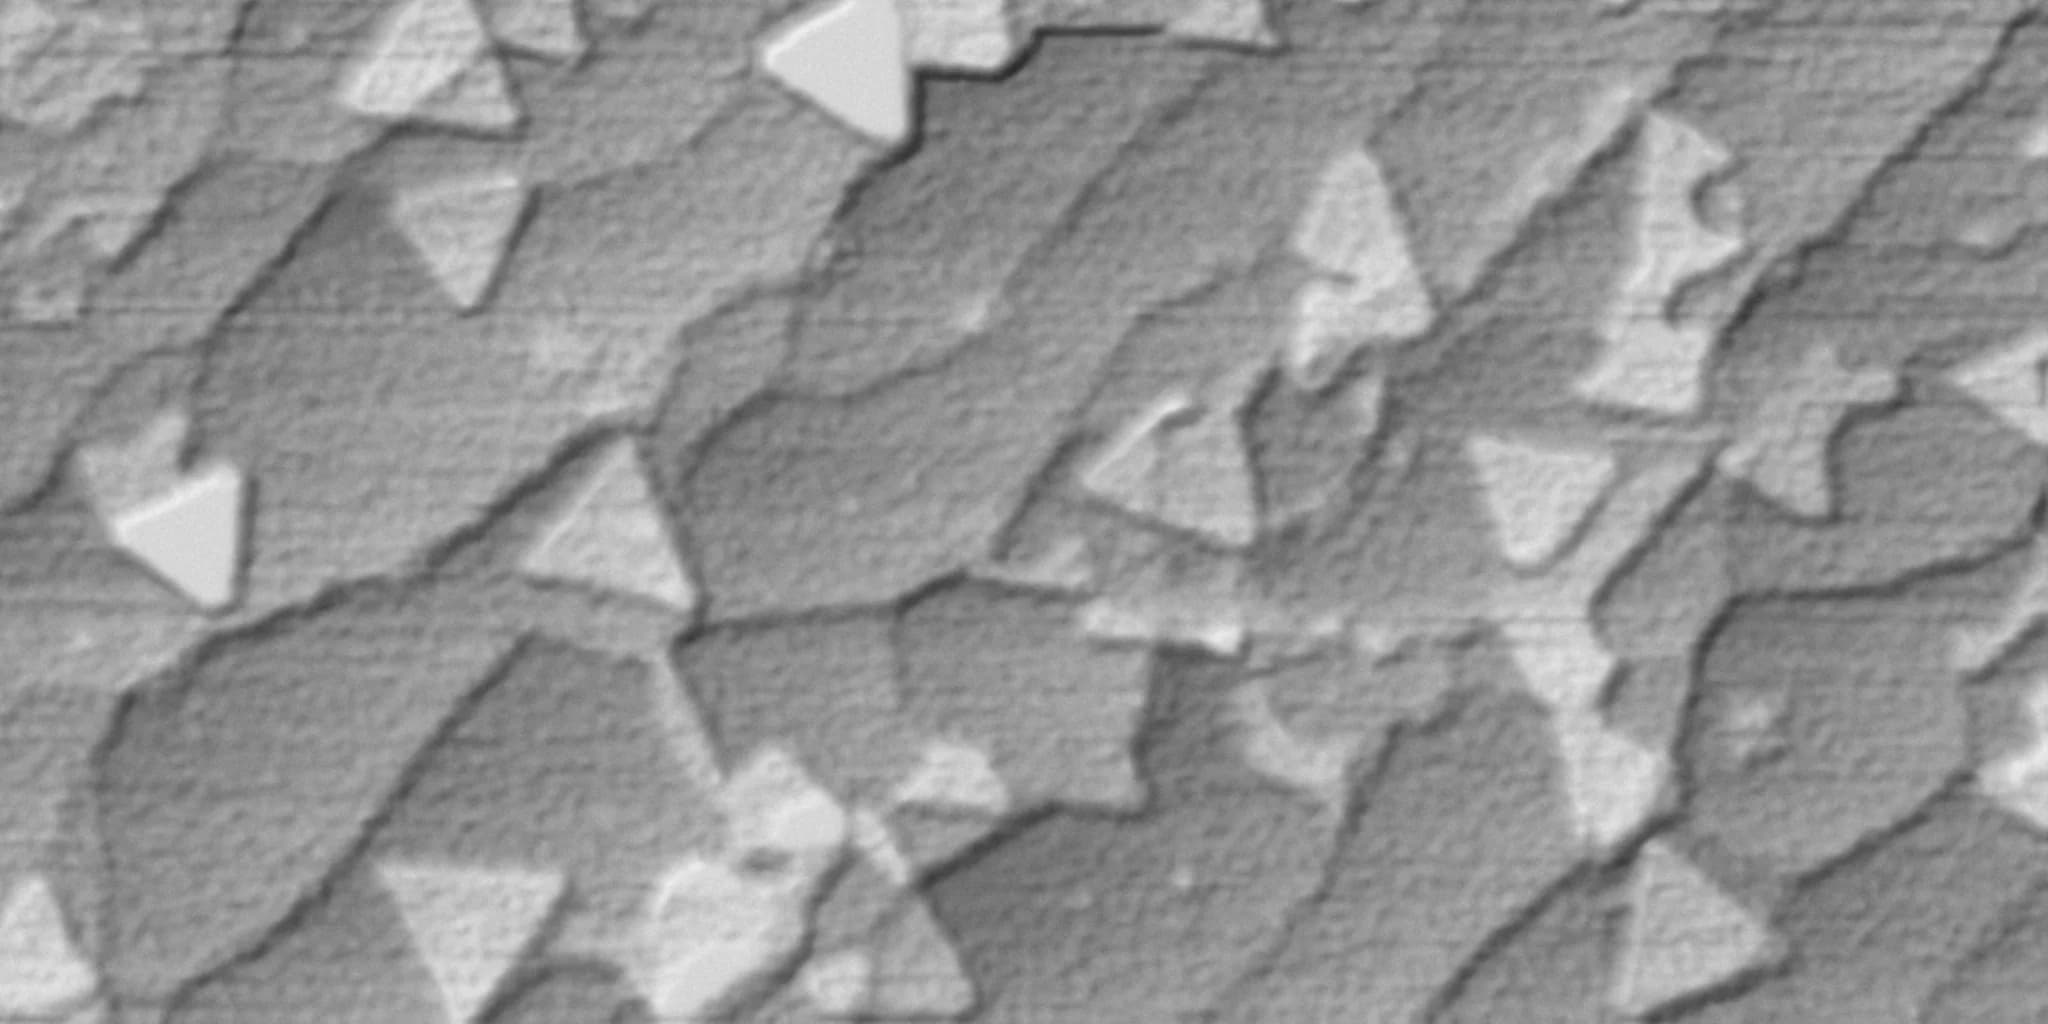
A measured 1 µm AFM scan of MOCVD WS₂, leveled and segmented by Atlas. Hover or tap the map to move the profile.
The problem
Every experiment is expensive. Most of what it teaches gets lost.
Developing a new material or qualifying a process takes many rounds of making, measuring, and adjusting. Each round is costly, yet what it reveals rarely makes it into the next one.
Data is scattered
Every instrument writes its own files. Results end up split across drives, spreadsheets, and notebooks, cut off from the sample and recipe that produced them.
Expertise is scarce
Reading a measurement correctly takes a specialist. When that person is busy or moves on, the interpretation goes with them.
Every guess is expensive
Without a connected picture, the next run is an educated guess, and each one costs days of equipment time and material.
How it works
A world model for your materials
Matter42 combines your measurements, your process history, the published literature, and physics-based simulation into one picture of how your process shapes your material. Every experiment makes that picture sharper.
- 1
Connect
Bring in data straight from your instruments, along with how each sample was made. Nothing needs to be reformatted first.
- 2
Understand
Matter42 analyzes the data, compares it with past runs and published results, and explains what it shows, with the evidence attached.
- 3
Decide
See which process changes are likely to move quality, uniformity, or yield, and choose the next run with fewer unknowns.
Every run teaches the next one
Atlas Metrology measures what came out of the reactor. Atlas Physics AI explains why and predicts what to change. The next measurement checks that prediction, so the model gets sharper with every experiment, and what your team learns stays with the project.
GaAs/GaAsP nanowire micro-PL · Patel et al. 2023
Atlas Metrology
Know what you made
Atlas parses Raman, PL, AFM, XRD, and XPS files straight from the instrument. Ask questions in plain language and get automated analysis through scientific workflows built by Matter42.
Explore Atlas Metrology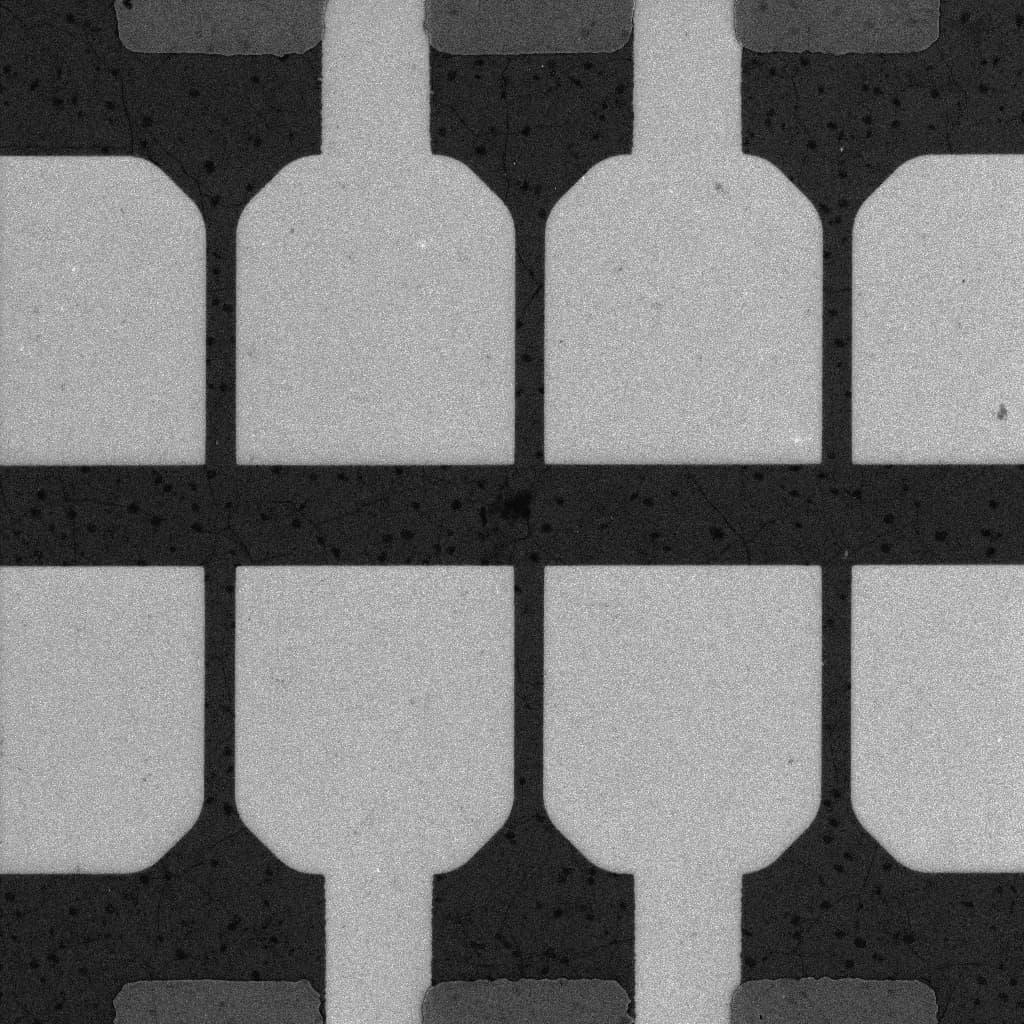
CVD graphene Hall bars, SEM · Supalová et al. 2025
Atlas Physics AI
Decide what to make next
Connect atomistic, meso, and continuum models into one picture of how your process shapes your material, and test the next process window before it costs reactor time.
Explore Atlas Physics AISecurity and deployment
Your process stays yours
Recipes and measurement data are some of the most sensitive IP in the industry. Run Matter42 where your data already lives, anywhere from our cloud to a single machine with no network connection at all.
Matter42 Cloud
Runs on our cloud or yours. We can host and run everything with your projects private to your organization, or run it in your own cloud or servers, behind your firewall, on hardware you control.
Fully air-gapped
Runs on one laptop or workstation with the network unplugged. Nothing is sent anywhere, and Blocks your team builds in the cloud export to run there too.
Real materials and measurements
From spectroscopy to microscopy, Atlas is trained on data from a wide range of materials: compound semiconductors, oxide films and crystals, quantum wells, colour centres, and low-dimensional materials.
Boise State University, Estrada group (collaborator data)
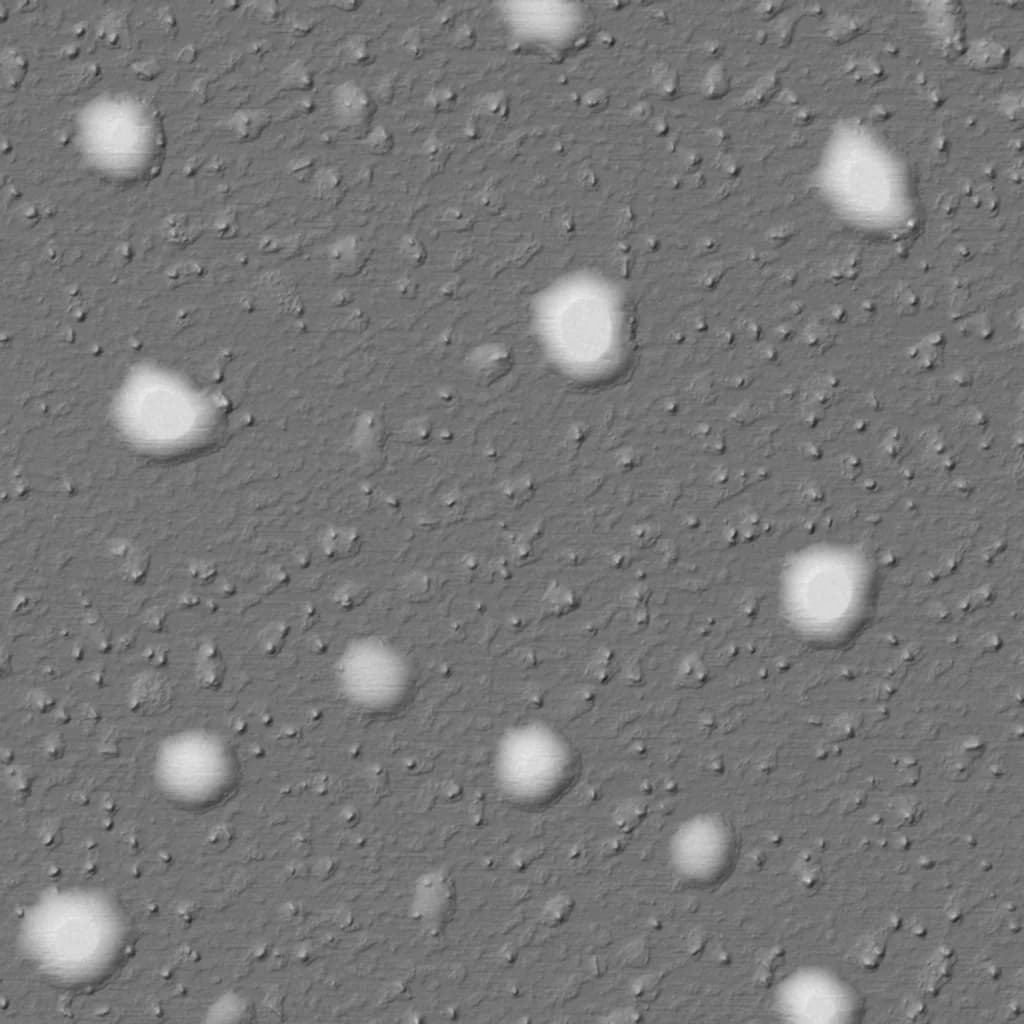
WS₂ islands, AFM
MOCVD WS₂ triangular islands on substrate step terraces, AFM topography (1 µm field)
Patel et al., ACS Appl. Mater. Interfaces (2023); Figshare 10.48420/22068005
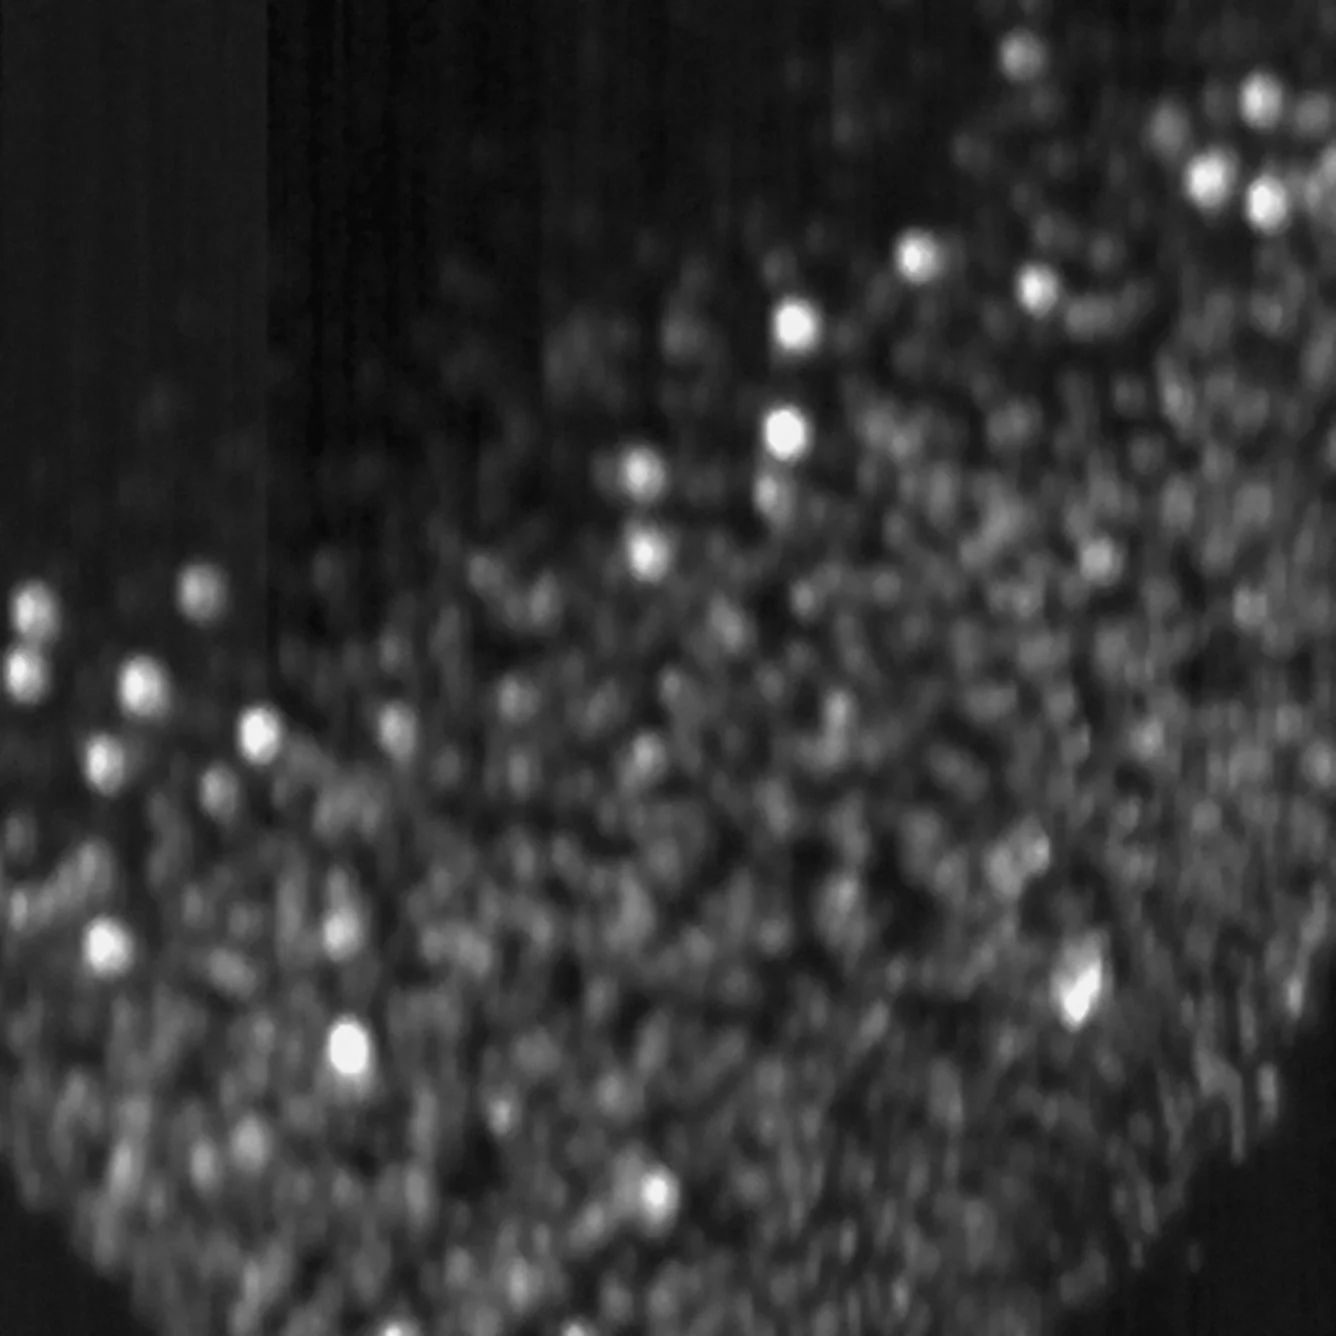
GaAs nanowire PL
GaAs/GaAsP nanowire emitters, confocal micro-PL band-edge intensity (100 µm field)
Moses & Reinhart, Mater. Charact. (2024); Zenodo 10.5281/zenodo.8432222
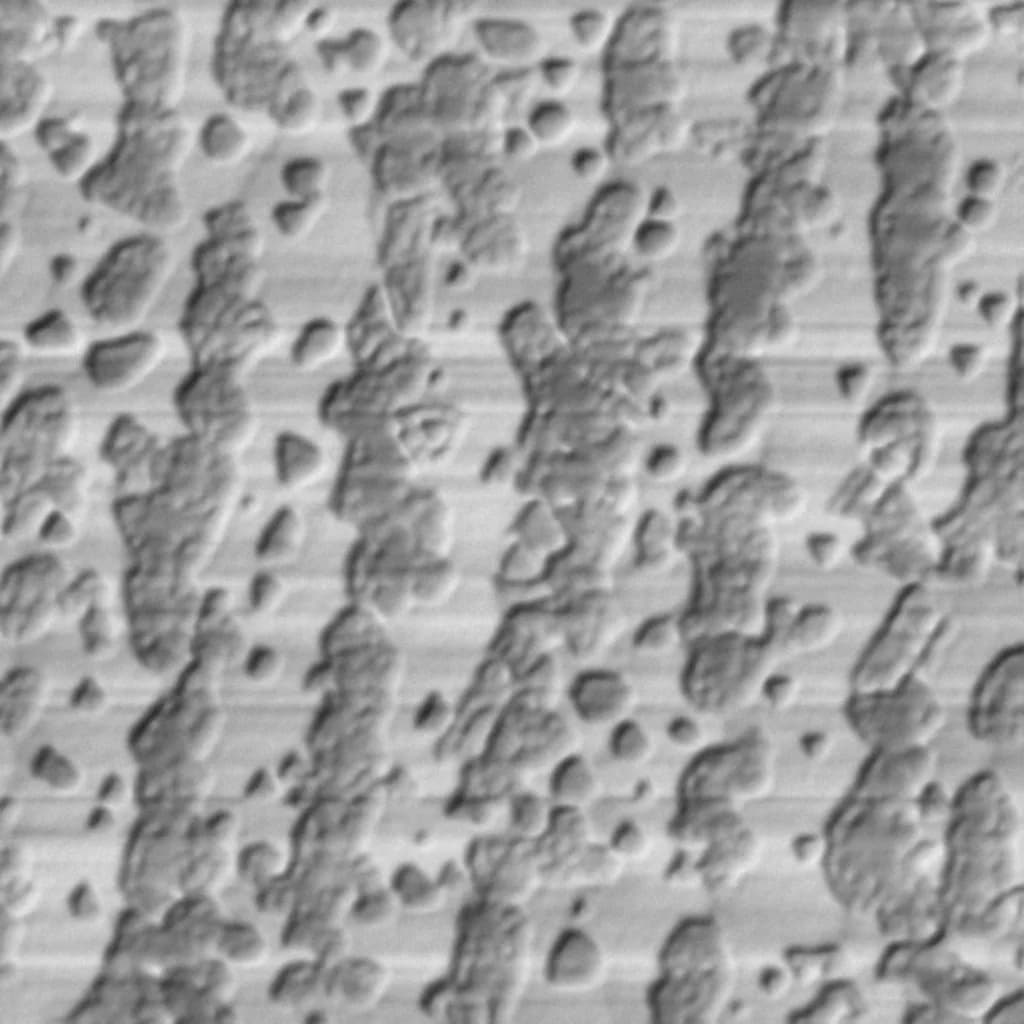
MoS₂ film at 1000 °C, AFM
MOCVD MoS₂ grown at 1000 °C on c-plane sapphire, AFM topography (5 µm field)
Weatherley et al., Nano Lett. 21, 5217 (2021); Zenodo 10.5281/zenodo.7702609
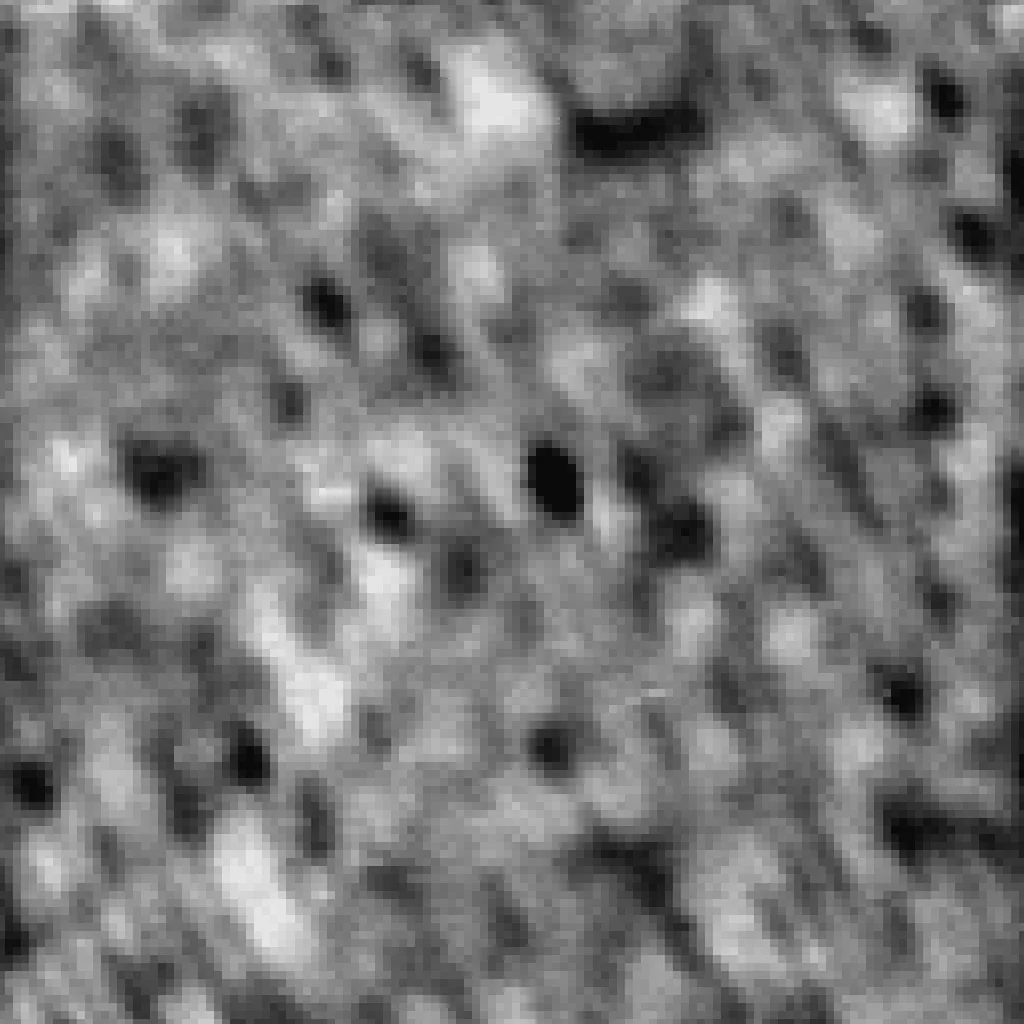
InGaN quantum well CL
InGaN/GaN quantum well, 10 K cathodoluminescence intensity; dark spots are threading dislocations
John et al. (2024); Zenodo 10.5281/zenodo.13868903
ZnO crystal face, AFM
ZnO single-crystal face after oxidative annealing at 700 °C, AFM topography (10 µm field)
Cilibrizzi et al. (2023); Zenodo 10.5281/zenodo.10066455
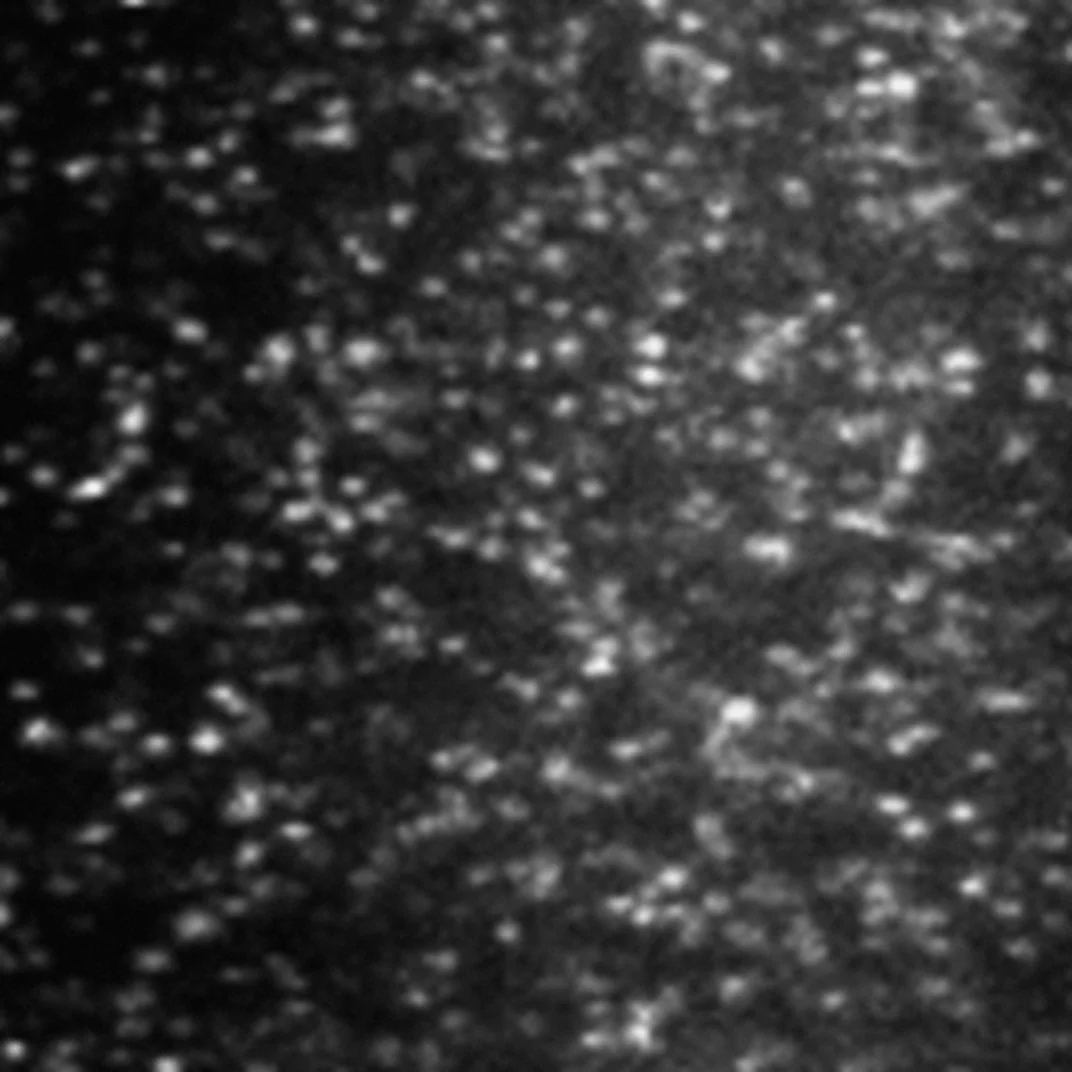
SiC colour centres
Isotopically enriched 4H-SiC, confocal PL of single vanadium colour centres (8 µm field)
Supalová et al. (2025); Zenodo 10.5281/zenodo.15601462
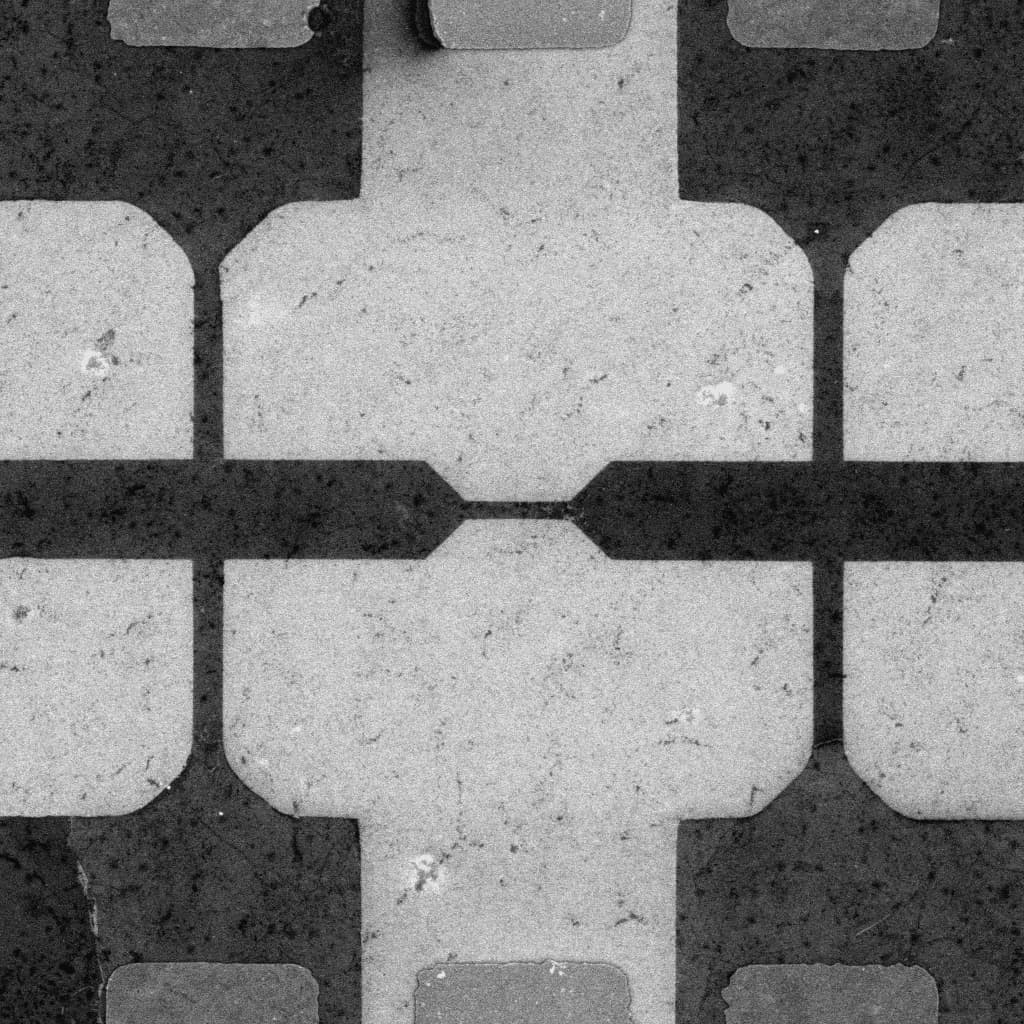
Graphene Hall cross
CVD graphene Hall cross, secondary-electron SEM (100 µm field)
Every instrument, one engine that shows its work
Atlas Metrology and Atlas Physics AI read your data the same way: each result comes back with the analysis drawn on the measurement, so you can see exactly where the number came from. Hover a tile to see what Atlas found, or open it for the full analysis.
- AFMWS₂ islands, MOCVD0.57 nmmonolayer step · 82 islands traced
- RamanWS₂, ion-beam patterned5.5 µmdamage halo found around every milled line
- CathodoluminescenceInGaN/GaN quantum well, 10 K1.4×10⁹ cm⁻²nonradiative defects · 85 located
- XRDGa₂O₃ on Si, annealing series19 nmβ-Ga₂O₃ crystallites, film crystallizes by 850 °C
- PhotoluminescenceMoSe₂–WSe₂ lateral heterostructure (CVD)82 meVWSe₂ shell around a MoSe₂ core, mapped from emission
- Atlas Physics AIWS₂ defects, simulated vs. measured5 defect typessimulated, then checked against 553 measured pixels
Data from five instruments and our physics models. Island outlines, damage halos, dark spots, phase peaks, and emission domains are Atlas outputs.
What changes
From traditional analysis software to Atlas
Instrument software is good at taking the measurement. Atlas carries it the rest of the way, to a result your whole team can trust, compare, and act on.
Context
One platform
Before: Split across vendor tools and desktops
With Atlas: Measurements, simulations, and literature in one place
Process context
Before: Separated from how the sample was made
With Atlas: Linked to process history and outcomes
Literature
Before: Lives outside the analysis tool
With Atlas: Structured literature inside the workflow
Analysis
Multimodal
Before: One modality, one tool at a time
With Atlas: Raman, PL, XRD, IR, XPS, microscopy, and more, together
Simulation
Before: Separate from characterization
With Atlas: DFT, KMC, mesoscale, and CFD connected to analysis
Automation
Before: Batch support varies by tool
With Atlas: Runs across samples, maps, files, and sweeps
Trust & decisions
Traceability
Before: Tool-specific audit trails, manual workflows
With Atlas: End-to-end provenance, calibration, and saved workflows
Decisions
Before: Interpretation waits on an expert
With Atlas: Results linked to interpretation and next actions
- Traditional analysis software
- With Atlas
Why we're building this
Every lab and every fab should have materials intelligence on tap.
Today that expertise lives in a handful of people, one-off scripts, and institutional memory. Matter42 combines calibrated physics-based models with multimodal analysis, so the path from measurement to decision is explicit, repeatable, and reviewable, whether it runs as your team's workspace, behind your instruments, or alongside our scientists as a service.
Built by people who have run the experiments
Decades of combined experience in materials physics, semiconductor process, and multiscale simulation, applied to turning raw characterization data into decisions.










4H-SiC vanadium centre PL · Cilibrizzi et al. 2023
See materials intelligence on your data
Bring a Raman map, a PL scan, or a process question. We’ll show how Atlas analyzes it and how it fits your workflow.